

Bitcoin Storm Tracker: March 13th 2021 Weekly Recap and Projection

TL;DR - The market is heating up, and the possibility of a cycle top by the end of June. Keep in mind more information could change this, but this week we make our first “cycle end” forecast.
We could see another local dip if the price rises above $70k in the next week. Last time the model predicted a local dip, the dip came early, so might be worth keeping that in mind.
End of March-Early April we could enter another consolidation zone, probably above $55k. Previous dips have stayed above the local ATH of the previous dip, so that implies we stay above $58k for the next local dip.
Moon math indicates we enter market euphoria mid-April when the price flirts with $100k. If this plays out, we could see $200k by mid-May and a cycle end before the end of June. Dare I say $500k is in play if interpreting the model after consuming too much hopium (although this is unlikely).
With more speculative lenses on, a 80% correction implies a bear market bottom in the next few years of $40k-100k.
I would like to remind readers this post is a purely educational exercise. I’m fitting models based on data and am probably wrong. Don’t construe this analysis as investment advice, I am not an investment advisor and you should seek one out before making decisions with your money.
The Forecast

The price action this past week has been exciting! It has returned to its all time high (ATH), and broken it, although at the time of writing it’s not clear if it will breeze through or if $60k will have some resistance as profit taking occurs at that level. Last time we recovered to the ATH from a dip, there was a small correction before moving upwards again.
This week I adjusted the plot limits to be more informative for the upcoming week. I think this will be the standard view moving forward as the retrospective view is less informative on a week-to-week basis. I’ll include the full history in some plots to provide more perspective if needed.
For the upcoming week, once the price decisively claims the ATH, we should see a short term rise until another correction. This could happen in the next week, but almost certainly will happen in the next two weeks. That said, we may be entering a more frenetic phase in the bull cycle and dips will occur over shorter timeframes.
Above $70k is a price to look at for when a local dip seems likely. In theory, we could reach $100k as soon as the next few weeks as its right at the upper 95% confidence band, although this would also mean a more intense local correction.
Analysis: Recap

This week is a good week for the forecast. Last week I discussed some factors that seemed to be adding turbulence to the price action, but admittedly I’m no macro expert. The model seemed to predict pent up energy that wanted to push the price higher, and that’s exactly what we saw this week. The $1.9 trillion stimulus passed in the US, and Europe declared a similar amount of money will be entering the Eurozone.
We expect this run to continue for the next few days, although another local dip is likely within the next two weeks.
When $100k? We could reach it before April, but a decisive move above it probably won’t happen until mid-April (see moon math below).
Critical Date

Critical date appears to be stabilizing around the end of June. This is the original date predicted when the forecasting started, but local dips have suggested healthy consolidation was going to extend the run. However, it appears we’re back on track for a fast and intense April and May. If over the next few weeks the critical date remains in this region, we can begin to build confidence that we we achieve the cycle top by July.
Analysis: Moon Math
I’ve been doing some moon math, math typically only reserved for those who have consumed too much hopium. Take this as pure speculation, incoming price data and unforeseen changes in information can swing this in a dramatically different direction.
If the model is right and we’re nearing the euphoria stage of the bull cycle, what will that look like?
Bull Cycle End Game

First of all, let’s keep in mind this bull cycle will end. The LPPL model we use allows for a small chance that we will achieve a high price and stay there without a large correction. That is pure hopium, but it will fuel calls that “this time is different” and we’re entering a “super-cycle”. However, in every previous bull cycle there’s been a 80% correction or so from ATH.
No one knows what will happen when we reach the top, but if the current scenario predicted by the model works out, we will start to enter the danger zone by Mid-April. This will be a euphoric time. Covid restrictions will be lifting, spring will be upon us, and everyday people and institutions will start to freak out over Bitcoin. In 2017, I have a friend who had a long chat about Bitcoin with their barber late November 2017. We saw a brutal correction at the end of December 2017 and didn’t return to those levels until late last year.
We may just break $200k in that time.
The critical date appears to be mid-May to end of June. This is the period where the model reaches a singularity, and where a correction is likely to occur. If the market “stays irrational” for an extended period into this region, somewhere between $300k-500k could be achieved. Some wild (but unlikely) trajectories go as high as $800k. It is unlikely we will go that high, but if the stars align, it’s not entirely impossible according to the model.
Then what? There’s a strong chance we will have a correction just like last time. But… the market cap is higher and more institutions have declared their investment thesis, so there’s reason to believe the correction will not to be as bad this time. However, let’s assume a 80% correction when coming down from our hopium high. If we reach $200k, that implies a bottom in the next 3 years of $40k. If we manage $500k, that implies a floor of $100k. Moon Math QED: $40-100k bear market bottom?
Residual Error Trends
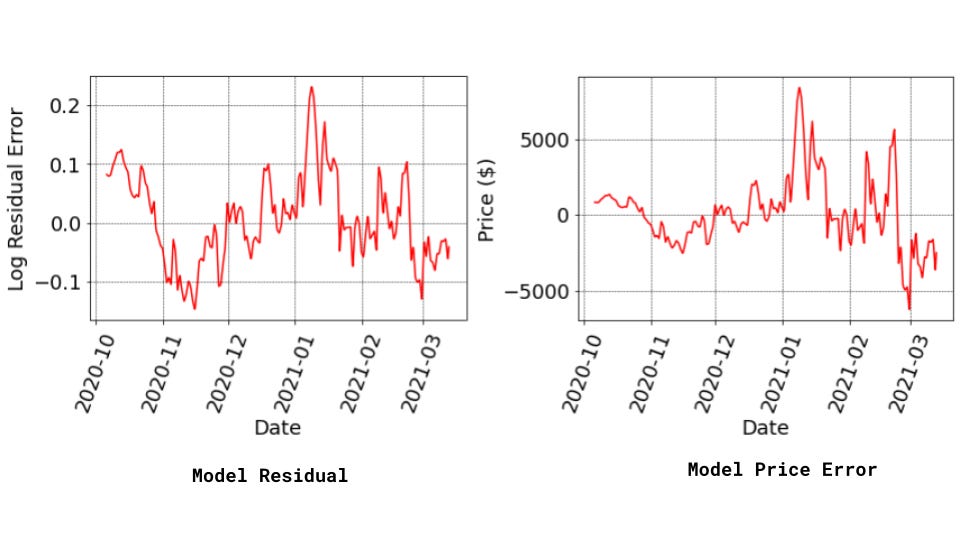
While maybe not the most exciting of the plots I generate using the bubble model, tracking residuals we can see that this last week broke the downward trend in the model error. Residuals should have a “zero mean” and so we expect for there to be some mean reversion in these plots. It looks like we’re moving back to a zero error and as this current local run heats up we could see the real price rise above the model prediction as we saw early January. This would be exciting, but could mean a local dip is imminent if the price rises above $70k in the coming week.
That’s it for this week, thanks for reading!
Great analysis. Thank you!
Always an interesting read. One thing I wonder about, it wasn't very long ago that BTC was under $10k. I'm trying to understand how it can look so certain that $40k is now the bear market bottom. Couldn't the market cycle later in the year mean a possible return to much lower prices than $40k?