Bitcoin Storm Tracker: April 3rd, 2021 Weekly Recap and Projection
TL;DR - Yet another week of sideways action. Short update this week because not much has changed structurally. Bullish hopes lie with April, the month of rebirth and rain.
Stable prices this week, resistance keeping prices below $60k.
Growing overextended leveraged positions could mean we have a brief swing lower, but all indications show that the market is anticipating a breakout.
The LPPL model is making a similar “rising price trend” prediction this week, but $50k is the statistical floor (~95% confidence). This has increased from about $45k predicted last week.
The mean price predicts a test of $100k by the end of April. We have recently been undershooting this level, but if euphoria takes hold this month, this is a statistically realistic possibility.
I would like to remind readers this post is a purely educational exercise. I’m fitting models based on data and am probably wrong. Don’t construe this analysis as investment advice, I am not an investment advisor and you should seek one out before making decisions with your money.
The Forecast
“How about this week?”
It feels like the LPPL model has been a bit of a broken record recently. The price action has underperformed the expectation set by the model, but it has stayed within the 95% confidence error bounds, such that the underperformance has not been statistically surprising.
There have been three $60k tests that have occurred over the last few weeks. Around February 22nd, March 14th, and this past week, the price has approached the $60k mark. The first two tests led to minor corrections and it remains to see if the third time’s the charm.
While the model is refit every week, we can look at the current fit to try and understand how the model is currently “thinking about” the previous $60k tests. According to the model fit, the first test was an overextension of the previous rally that broke the previous $50k (or €40k ) resistance, and the price then checked the lower confidence bound. The second test confirmed the average price as the model predicted sideways consolidation. This third test occurs below the expected price, right as the model expects a new rally through the month of April. Using this “statistical hindsight,” this test looks to have a better setup for a price rally than the previous two. Time will tell, but as we’ve come to expect, the LPPL model is bullish.
Analysis: Recap
The LPPL model keeps predicting a rally. While you could say a broken clock is correct twice a day, the actual model fit has been relatively stable these past few weeks, and the price has been well within the confidence bound. We’re exiting the region it expected for local consolidation, and the lower confidence bound is steadily rising from $45k last week to slightly above $50k this week.
That said, continued consolidation between $50k-$60k is still statistically possible this week, but this region is getting increasingly less likely as we move further into April.
Critical Date
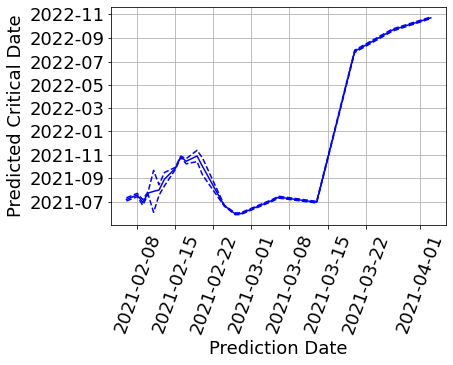
As discussed in the previous weeks, the most recent consolidation between $50k-$60k has pushed the critical date further into the future. The jump to next year indicates that the model thinks the price is no longer increasing super-exponentially.
There is a possibility it swings back to the dates predicted in early March (where it predicted a June-July critical date) if there is a strong April rally. The conventional wisdom is that there will be a top at the end of the year, which is roughly the average critical date if you consider all predictions made since early February. It’s interesting when statistics and gut-feeling begin to agree. Sometimes market expectations become self-fulfilling.
Thanks for reading!


