

Bitcoin Storm Tracker: March 27th, 2021 Weekly Recap and Projection

TL;DR - Another week of sideways action. Possibly due to end of quarter rebalancing and options expiration. March is a bad month historically, will April revalidate the LPPL model, or is a new model needed?
Price did not go below $50k this week, which was the forecasted lower limit (95% confidence). We could see lower this coming week, however, ~$45k is the lower limit.
The LPPL model has been very optimistic and is still bullish for April. Time will tell to determine if the price will return to that predicted by LPPL, or if a new model is needed.
The long-term forecast still looks strong, sometimes it’s important to zoom out and gain perspective.
First Formula 1 GP weekend, how is Bitcoin related? (Hint: sponsors and math!)
I would like to remind readers this post is a purely educational exercise. I’m fitting models based on data and am probably wrong. Don’t construe this analysis as investment advice, I am not an investment advisor and you should seek one out before making decisions with your money.
The Forecast

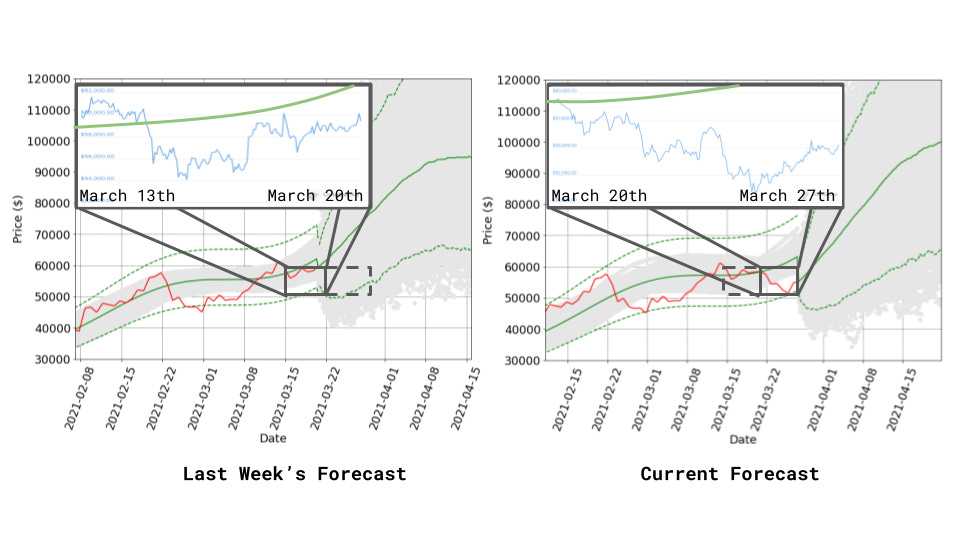
Here is the forecast for this week. While the LPPL model is still quite optimistic the price is about to break out of the current slump, the lower 95% confidence bound has dropped even further to about ~$45k.
The mean price should closer to $65k, so if the current price action is due to temporary market conditions, we should expect the price to return to a higher level. I’m personally waiting for mid-April until I discount the current forecasting model. We are right at the lower bound, and in the past, this has preceded a move upwards.
However, as discussed below, we could be seeing a more systemic shift and the current LPPL bull run model may continue to over-promise.
Analysis: Recap
This week’s price was within the expected range but definitely pushed the lower end. There were some special market conditions, such as the expiration of quarterly options this past Friday, first-quarter rebalancing, or retail selling to pay 2020 taxes. There may be many reasons this month has not performed as well, but this is actually in line with historical performance.
NYDIG published an interesting report last month showing seasonal performance in March is typically poor for Bitcoin, but April is typically much better. Will April re-validate the LPPL model, or is another model needed?
Critical Date: Has something changed?

This week the critical date has remained pushed back much further than previous forecasts. This can be seen by the last two weeks’ predictions compared to the previous week’s predictions, they both appear as outliers.
This indicates that the “super-exponential” part of the LPPL model is not fitting well, essentially meaning that the market has dramatically cooled off. This does not mean that things will stay this way, and time will tell whether we return to “super-exponential” price growth.
I’ve been exploring some other models, but in the meantime, it’s worth taking a step back to look at the big picture.
Analysis: Long-term Tracking Update
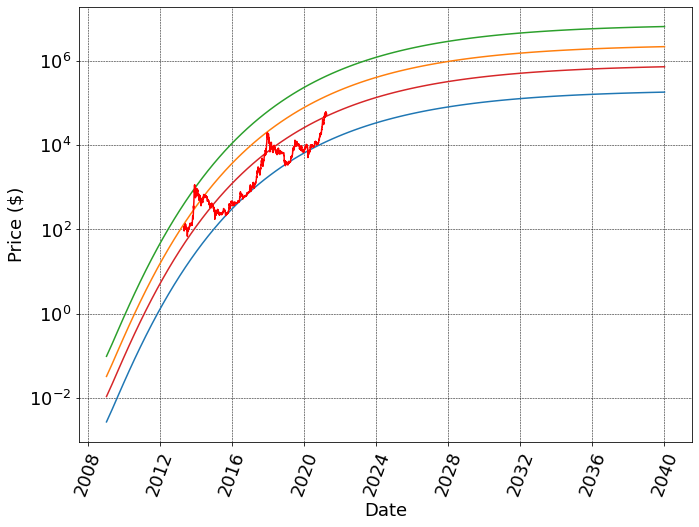
Looking at the long-term S-curve adoption plot, we can gain some perspective to see how things might look in the future. The model shown above is a modification of the typical “rainbow chart” showing sigmoid (s-curves) with Metcalfe’s Law (valuing the network effect) applied. More on this in an older post.
The point is, price is consistent with continuing adoption, and the big question this cycle is will we have another 80% correction, or will stronger hands push further adoption without as much downside volatility?
Philosophy: Bitcoin and the first Formula 1 Grand Prix of 2021
This weekend is the first Formula 1 Grand Prix of the 2021 season.
While perhaps seemingly orthogonal to Bitcoin price, the technology in Formula 1 presents an interesting analogy to many of the concepts for understanding the shorter-term price volatility in Bitcoin. This is admittedly a stretch, but Crypto.com has become a sponsor of the newly branded Aston Martin team, who has also dipped their toes in the "exciting" (lucrative) world of NFTs. So it's relevant, ok? Also, for those with more social media clout than me, please campaign Coinbase and Zac Brown (McLaren Team CEO) to form a partnership, I genuinely think that would be good for the sport of F1 and Bitcoin as a whole. After all, Daniel Ricciardo is the Honey Badger of Formula 1 and is a driver for McLaren this year. And of course, Bitcoin is the Honey Badger of the crypto world.
What am I on about?1
Springs and Nonlinear failure modes
Any racing driver knows that suspension and grip are among the two most important technical considerations when driving around a track.
Suspension can be modeled by spring-mass systems, which also happen to be one of the simplest dynamical systems one can study and can be used to model oscillations in asset prices like Bitcoin.
Conversely, grip is a familiar non-linear effect, tires work well up until a critical point, upon which static friction gives way to kinetic friction and the car goes sliding off the track. In Bitcoin, we can think of cascading liquidations of leveraged positions as losing grip on the racetrack. It is a nonlinear effect, as you don't see it until a point, and then the effect is undeniably catastrophic (in the short term).
Springs: Harmonic Motion
Dynamic systems is a field that studies how things change over time. In particular, we can establish simple rules that describe how systems transition from one state to another, and by moving through time and applying these rules, we can simulate how a system evolves.
A simple example is a mass-spring system. In this case, a mass, like a brass weight or a car chassis, is suspended from a spring. However, if a force is applied to either push the mass up or down, the spring applies a restoring force to the mass. It turns out that this results in oscillating motion.
If a car's suspension is not tuned properly, or the road surface is not appropriate, resonances and extreme uncontrolled oscillation can take place. Just look at how dirt roads form regular patterns due to the interaction of the soft road surface inducing resonance in the suspension in a reinforcing, feedback-driven system.
To me at least, this seems extremely relevant to understanding Bitcoin's price action! In an uncoordinated set of random events, highly regular oscillations appear, as the price oscillates around a particular price.
These oscillations are highly intuitive, but also pop out of the math in a really magical way.
Springs introduce a restoring force proportional to the deviation from their resting state: F = -k * x, where k is a constant "springiness factor" and x is the distance of the mass from its static resting point. There's a negative sign since the force of the spring "pushes back" against the force applied to it. As such, if we push on the mass, the spring applies a force to push it back to its resting point. From Newton's second law, force is mass times acceleration (F = m a, and “a” is acceleration, the second derivative of position with respect to time), we can write this out as a "differential equation":

In general, we could create a simulation (like in a game engine) to update the position for discrete steps in time. However, for this differential equation, so we obtain a perfect solution (no approximations) that describes the mass position over time using calculus (or you can look up the solution on Wikipedia like I did):
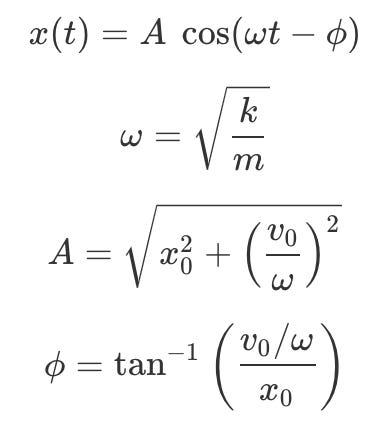
Where x_0 is the initial position of the mass and v_0 is the initial velocity.
Ok, so the important part is, there is is oscillation! This is seen in the cosine term, which looks like a squiggly line, or "sine wave." If you refer to the LPPL model, you'll see that a similar cosine term is there. LPPL is also a solution to a differential equation, and oscillations are very common when solving for these systems. This is a whole applied maths universe–for those interested in learning more–some key terms (mapping roughly to standard undergrad-level engineering courses) are Linear Systems, Control Theory, Fourier Analysis, Complex Analysis, Complex Systems Theory.
If you were to listen to a sine (or cosine) wave played on a speaker, it would sound like a single tone. The other thing to note is all the quantities are determined by the mass, m, and the spring constant, k. For example, ω controls the frequency of the oscillation, if the spring becomes stiffer, k is larger and the oscillation frequency increases, while if the mass increases, the oscillation frequency decreases.
Let's think about this, what is the price "mass" mean? What does the "spring constant" of Bitcoin? As the market cap increases, more capital is needed to move the price, which is "mass-like" and the amount of liquidity could maybe be seen as the "spring constant like". The more liquidity, the faster the system restores itself, and any oscillations are quite high frequency. As liquidity drains from exchanges, but the market cap increases, these two effects may stabilize somewhat.
If there is some external force that pushes the price of bitcoin up above what people think it's worth, then if a mass-spring system described its dynamics, we would expect a restoring force (people taking profits) to bring it back in line. Conversely, if the price seems undervalued, people will buy the dip. Following the mass-spring system logic, this will induce a "ringing" or oscillations in the price.
These ringing effects mean that the price would "overshoot" and then "dip" after an impulse, or "big buy" is applied. Conversely, if the price dips first, we expect a "dead cat bounce" before returning to the new low. In reality, the system is probably "damped" meaning that oscillations drain some energy from the system, so the ringing decreases after a force is applied, and the system doesn't ring forever.
Of course, simple harmonic motion models a linear restoring force, which makes it easy to analyze but poor at modeling all phenomena. In particular, leverage introduces nonlinearities which we can liken to "grip" of a tire on a road surface.
Grip: Cascading Liquidations
When a tire grips the road, the road exerts a force back. This force is proportional to the "coefficient of friction" or how much the input force is applied back. What's weird about friction is that it's caused by tiny interaction of surface textures, such that when enough force is applied, the object starts sliding, but the coefficient of friction changes as the surfaces "skate" over each other. When sliding, the road pushes back less than when not sliding.
This means that the influence of force applied is not entirely counteracted by the road, but suddenly the force applied is more effective, and this is a nonlinear effect. Nonlinearities make our life interesting.
If someone buys bitcoin on leverage and the price moves with the trader's position, the price behaves linearly, like the mass-spring system (price moves up and is pulled back by taking profits). However, if the price moves against the trader, they might have to sell more of their bitcoin than the same trade without leverage. This one-sided effect is nonlinear, and their bitcoin purchased Tesla begins sliding off the road to financial independence.
Here's an example:
Sophie the trader has 1 BTC when the price is $50k. She can use this BTC as collateral to borrow USD and buy 5 BTC at 5x leverage against her 1 BTC. If the price increases by 20% to $60k, she sells the 5 BTC, returns the borrowed USD, and makes a nice profit. 5 BTC exit the market when she buys, 5 BTC enter the market when she sells, no problem. However, if the price drops 20% to $40k, then she may be liquidated to cover the cost of the loan. In this case, 5 BTC exit the market when she buys, but 6 BTC enter the market when she sells. Not only did she lose BTC, but more BTC supply enters the market than would have in a "linear scenario" without leverage. If Sophie had the cash, she would have purchased 5 BTC, then panic solid 5 BTC, not 6 BTC.
When a tire begins sliding, the coefficient of friction decreases and the car is much harder to control because the amount of grip changes quickly. Conversely, when bitcoin dips below the liquidation price of over-leveraged traders, the price swings much lower than would happen in a zero-leverage environment. Liquidations can cascade, wiping out traders en masse. Since many people use BTC as collateral and extremely high amounts of leverage (100x even), this effect is highly pronounced. Rekt = Wrecked.
To summarize, if you're a whale, and have the capital to fund leverage (like an exchange) it may be highly lucrative to attempt to trigger liquidations.
However, in an environment with a high market cap (mass) and liquid market (stiff spring), it would be difficult to have an outsized effect on price (you'd have to sell more than you might make back catching the fast-moving swing back). If there is leverage, you might actually not need to sell that much, while amplifying the effect on price.
Anyway, these analogies only go so far but may provide some more mathematical and physics-based intuition behind Bitcoin price action. Until next time, thanks for reading!
I'm not actually English, but Formula1 makes me think in a Northhamptonshire accent.
More institutional money moving into Bitcoin will stabilize volatility and add more liquidity by nature.